Part of: Life Path Numbers →
Original research · last updated 2 October 2026
Three numbers, all of them right
- 0.30% — PathNumbers, U.S. births 2000–2014.
- 0.68% — NYMERŌ, every calendar date 1900–2025 (46,021 dates).
- 0.89% — ours, every calendar date 1940–2009 (25,568 dates).
None of these is a mistake. They are three answers to three different questions, and the gap between them is wide for three numbers that all describe “how rare a 33 is.”
The obvious suspicion is that one of them counted people and the others only counted dates — that real births are clustered in ways the calendar isn’t, and that’s where the gap comes from. That is a testable idea, so we tested it: 85,386,227 recorded U.S. births, against the same calendar we published last time.
The answer wasn’t the one we expected to matter.
The four coordinates
Any rarity percentage needs four things stated before it can be compared with another one. We applied that rule to our own figure first, before applying it to anyone else’s. Here are this study’s four:
How to read this study’s figures
- Method Pythagorean, components reduced separately, 11/22/33 preserved
- Window 1 January 1994 – 31 December 2014 (7,670 dates)
- Population Recorded U.S. births — CDC/NCHS 1994–2003 and SSA 2000–2014, via FiveThirtyEight (CC BY 4.0)
- Weighting Both — a calendar-uniform baseline and a birth-weighted distribution, compared
Change any one of these four and the percentage changes with it. That is the whole point of stating them.
Key takeaways
- 85,386,227 U.S. births analyzed
- Largest birth-weighting shift: 0.1053 percentage points
- Life Path 33: 0.2868% of calendar dates 1994–2014 vs 0.2889% of recorded births in the same window
- The four rarest Life Paths unchanged across calendar dates 1994–2014: 33, 22, 2, 11
- For six Life Paths (33, 2, 11, 4, 6, 22), year-window differences exceeded the largest birth-weighting effect observed
What we tested, and what we decided before we looked
The protocol rules below were fixed before the results were read; the record of that is the study script itself. That matters more than it sounds, because with twelve numbers and several ways to slice them, a study that decides what counts after seeing the output can find almost any story it wants.
So we fixed, before looking, the rules that would decide what counted:
- A seam test with a threshold fixed in advance. Our two data sources overlap on 2000–2003. If any Life Path differed between them by more than 0.05 percentage points, the combined series was disqualified and the analysis would run on one source only. The largest difference was 0.0049 pp, and the rarity order was identical in both sources, so the combined 1994–2014 series was used — by the rule, not by preference.
- The same window for both distributions. The calendar baseline and the birth-weighted distribution cover exactly the same 7,670 dates. Comparing a percentage from one range against a percentage from another is the error this whole study is about; we weren’t going to commit it internally.
- A split-half check. Every effect had to appear in both halves of the window, in the same direction, or it doesn’t get reported as a general finding. More on that below, because several didn’t.
- A leap-day sensitivity run. The whole analysis again with 29 February removed. No result moved by more than 0.0040 pp, and no effect changed direction.
The result: births barely moved the calendar
Weighting every date by how many babies were actually born on it changes the picture very little.
The largest shift across all twelve numbers is +0.1053 percentage points, on Life Path 22 (3.4811% of dates, 3.5864% of births). Every other number moves less than that, most of them far less. The four rarest positions — 33, 22, 2, 11 — are the same in both distributions.
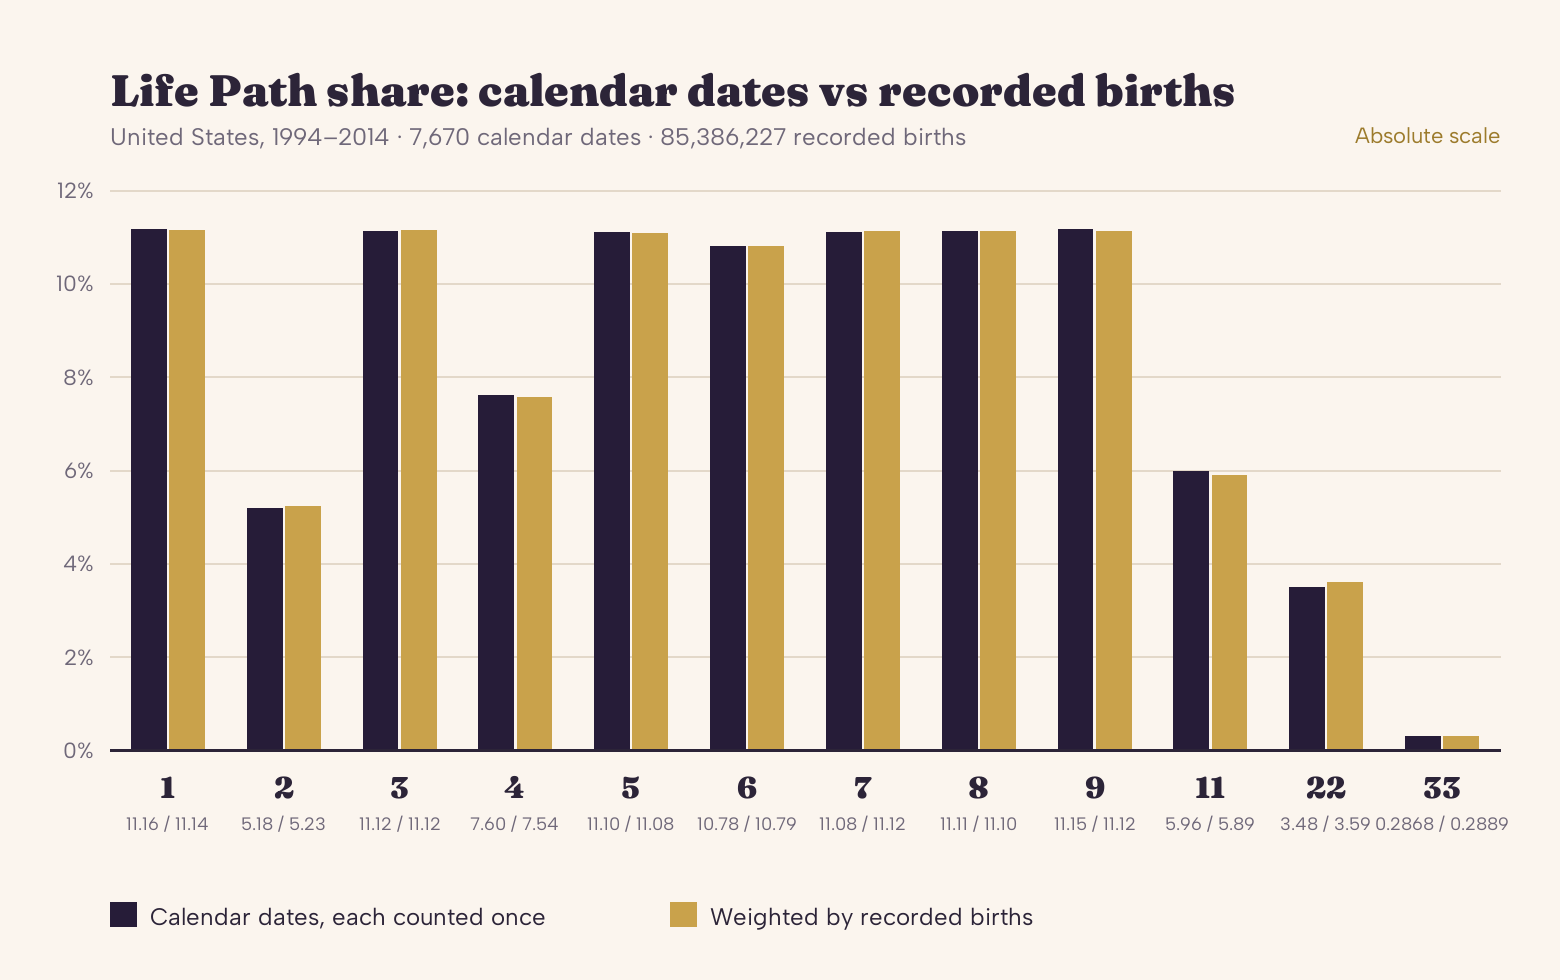
The full table, 1994–2014:
| Life Path | Calendar dates | Weighted by births | Difference (pp) |
|---|---|---|---|
| 1† | 11.1604% | 11.1404% | −0.0199 |
| 2 | 5.1760% | 5.2274% | +0.0513 |
| 3† | 11.1213% | 11.1243% | +0.0031 |
| 4 | 7.6010% | 7.5441% | −0.0570 |
| 5 | 11.0952% | 11.0769% | −0.0183 |
| 6† | 10.7823% | 10.7857% | +0.0034 |
| 7 | 11.0821% | 11.1153% | +0.0331 |
| 8† | 11.1082% | 11.1044% | −0.0038 |
| 9† | 11.1473% | 11.1200% | −0.0274 |
| 11 | 5.9583% | 5.8863% | −0.0720 |
| 22 | 3.4811% | 3.5864% | +0.1053 |
| 33† | 0.2868% | 0.2889% | +0.0021 |
† Direction not stable across the two halves of the window — read these rows as magnitudes only (see “What we’re not reporting”).
Real birth timing is not flat — in this dataset the average weekend day saw 34.4% fewer births than the average weekday. But Life Path is computed from day, month and year together, and those clusters land across all twelve numbers rather than piling onto one. Eighty-five million births, and the four rarest positions hold.
Births by day of the week, U.S. 1994–2014
Tuesday was the busiest day of the week in this window, at an average of 12,787.7 births, and Sunday the quietest, at 7,610.3. Monday through Friday averaged 12,345.3 births a day against 8,101.5 on Saturday and Sunday, putting the weekend 34.4% below the weekday average, the same gap quoted earlier on this page.
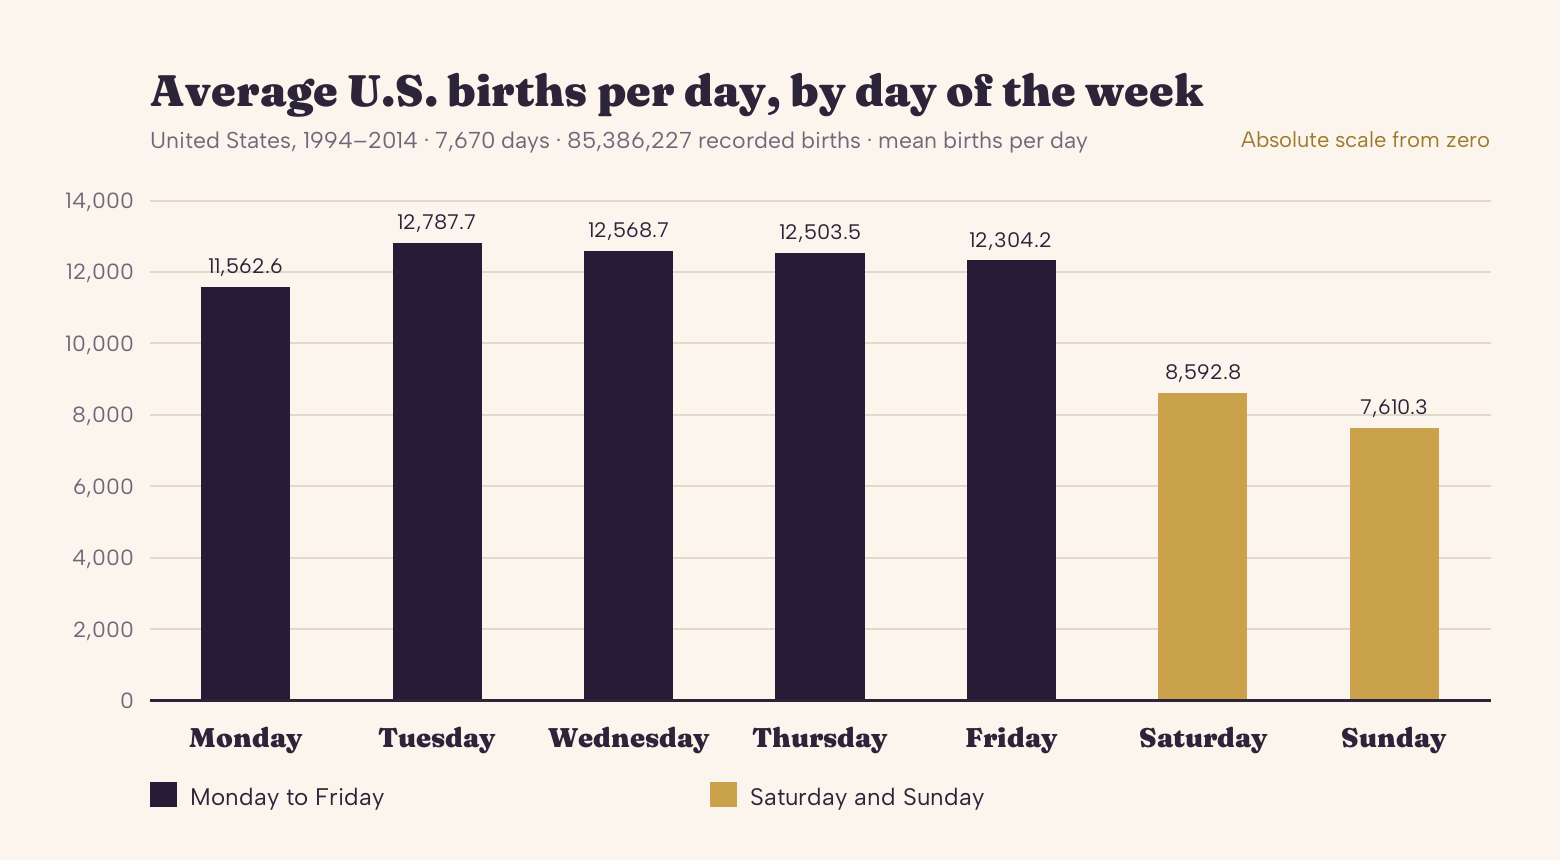
Same data as the rest of this page: the stitched 1994–2014 daily series, 7,670 days and 85,386,227 recorded births, each day’s recorded births averaged by weekday. Scheduled deliveries are a documented contributor to the pattern: CDC/NCHS attributes the weekend and holiday deficit in part to the scheduling of cesarean deliveries.
The repeating dates: 7/7/07 to 12/12/12
Six dates inside this window repeat the same number three times, from 7/7/07 to 12/12/12, and we checked whether they were unusually busy.
| Date | Weekday | Births | Expected births | Difference | Rank that year |
|---|---|---|---|---|---|
| 7/7/07 | Saturday | 10,499 | 8,925.8 | +17.6% | 254 of 365 |
| 8/8/08 | Friday | 15,374 | 13,114.2 | +17.2% | 2 of 366 |
| 9/9/09 | Wednesday | 16,081 | 13,254.1 | +21.3% | 1 of 365 |
| 10/10/10 | Sunday | 8,490 | 7,184.1 | +18.2% | 262 of 365 |
| 11/11/11 | Friday | 14,392 | 12,205.0 | +17.9% | 1 of 365 |
| 12/12/12 | Wednesday | 14,667 | 12,406.3 | +18.2% | 1 of 366 |
All six recorded more births than the average day of that weekday in that year, and three of them — 9/9/09, 11/11/11 and 12/12/12 — were the busiest single day of their calendar year.
The six earlier dates with the same pattern, 1/1/01 to 6/6/06, ranged from 33.6% below that expectation to 8.3% above it, and none of them cleared 10%.
A widely reported prediction before 11/11/11 held that the date would set a birth record; we found no published check of it afterwards. In this series it was the busiest day of 2011.
This series records daily totals only — no split between scheduled and spontaneous deliveries — so it can say these days were busier than comparable days, and no more.
Same stitched 1994–2014 series as the rest of this page; the expectation is that weekday’s mean across the same calendar year.
What actually moves the number: the years you measure
Here is the part we did not predict.
To be exact, we did not plan it either: this comparison was added after the main analysis. It is arithmetic on calendar dates, no weighting involved, so anyone can rerun it.
Take the birth weighting away entirely and compare two calendar-uniform windows — 1994–2014 against 1900–2025, same method, dates counted once either way. For six Life Paths, that difference is larger than the biggest birth-weighting effect anywhere in the study:
| Life Path | Effect of weighting by births (pp) | Effect of changing the window (pp) |
|---|---|---|
| 33 | 0.0021 | 0.3911 |
| 2 | 0.0513 | 0.4064 |
| 11 | 0.0720 | 0.3823 |
| 4 | 0.0570 | 0.3301 |
| 6 | 0.0034 | 0.3501 |
| 22 | 0.1053 | 0.2999 |
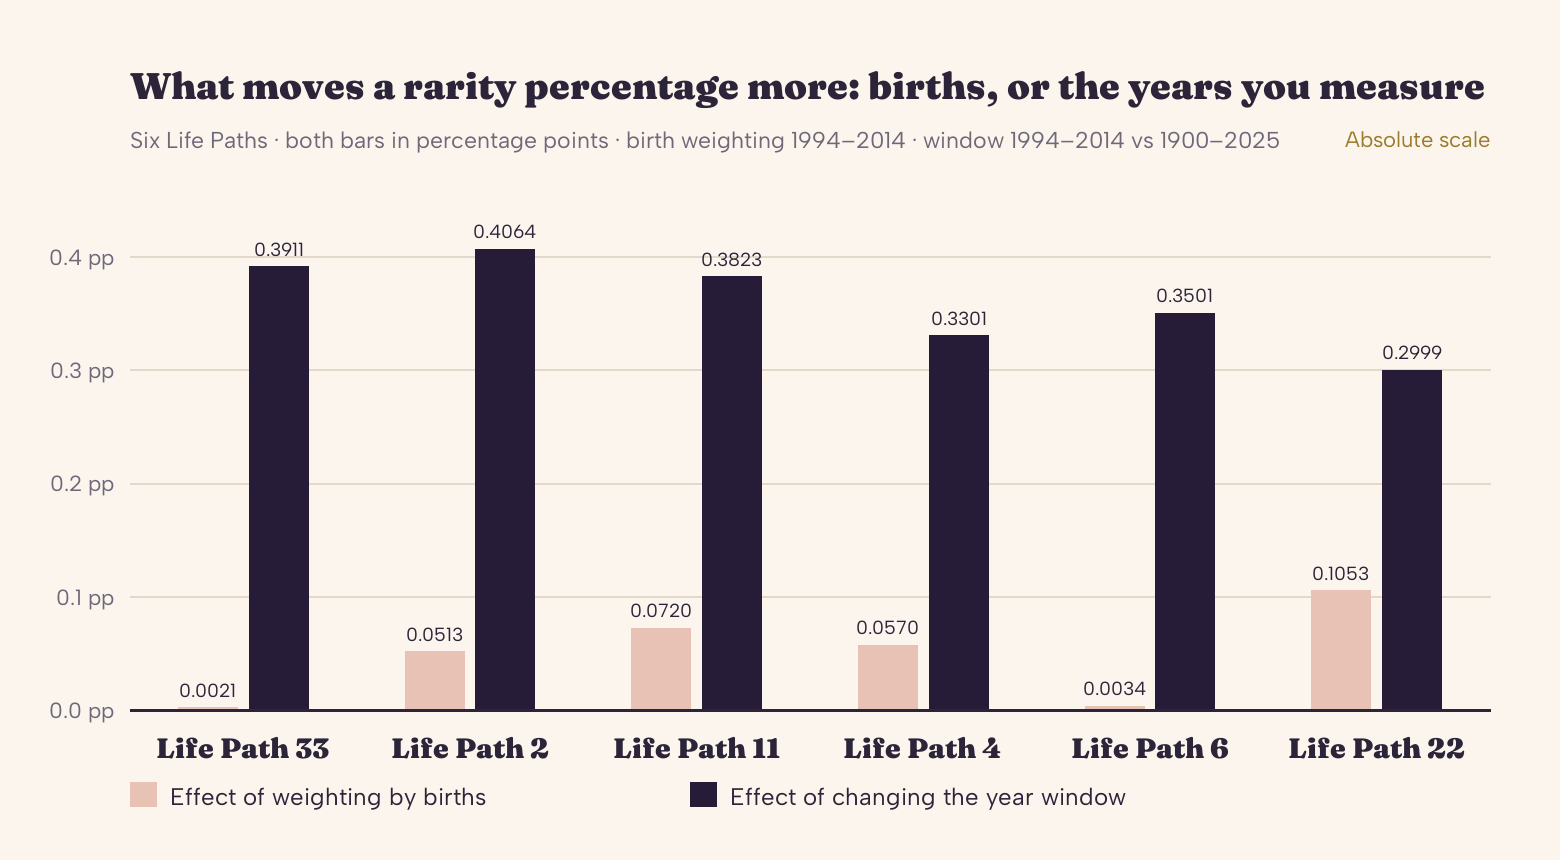
Life Path 33 is the clearest case. Across three windows, same method every time:
- 0.2868% — calendar dates 1994–2014
- 0.6780% — calendar dates 1900–2025
- 0.89% — calendar dates 1940–2009 (our published rarity study)
The arithmetic behind it: a Life Path of 33 needs the reduced day, month and year to sum to exactly 33, and the parts can’t all run high at once. A day reaches 22 only on the 22nd; a month tops out at 11 in November; so the year does most of the work. A year whose digits reduce to 22 — 1939, 1948, 1957, 1966, 1975, 1984 and 1993 — contains 27 such dates; a year reducing to 8 or to 11 contains 2; a year reducing to 1 contains none; every other year between 1900 and 2025 contains exactly 1. No year between 2000 and 2025 reduces to 22. Include more of the high-count years and the share rises; leave them out and it falls.
So the honest reading of three disagreeing percentages isn’t that someone measured badly. It’s that the year range does more work than the population choice — which is why the window belongs next to every figure, ours included.
What we’re not reporting, and why
The split-half check exists to stop us from publishing noise, and it did its job.
An effect had to point the same way in 1994–2003 and in 2004–2014 to count as a general finding. Six did: Life Paths 2, 4, 5, 7, 11 and 22. Six did not — for Life Paths 1, 3, 6, 8, 9 and 33, the direction flips between the two halves.
That doesn’t mean nothing is happening there. It means whatever is happening looks more like a change over time than a stable property of the number, and one study cutting one window can’t tell those apart. So those six are marked and set aside. They are not in our findings, they are not in our headline, and they should not be quoted from this page as directional results.
We are stating this plainly because it is the difference between a finding and a coincidence, and because half our numbers landed on the wrong side of it.
A prediction we wrote down first, and how it resolved
Before running the comparison, we wrote down a specific claim; it sits in the comparison record next to the result.
PathNumbers publishes 0.30% for Life Path 33, over U.S. births 2000–2014. We predicted that this figure would fall within 0.05 percentage points of our own calendar-uniform baseline for the same 2000–2014 window, which we computed independently at 0.2920%. The stated reason, recorded in advance: our study had already shown that weighting by births moves a share by at most 0.1053 pp, so a birth-based figure and a calendar-based figure over the same years should land close together. (For Life Path 33 itself, the weighting effect was 0.0021 pp.)
Confirmed — the difference is 0.008 percentage points.
Their published result is almost indistinguishable from the calendar baseline for the same period, which is consistent with our finding that weighting changes very little there.
NYMERŌ’s 0.68% covers every calendar date from 1900 to 2025 — a different window. We checked it the only way we could: by running that same window under our own method. NYMERŌ reports 312 dates out of 46,021; our run counts 312, which is 0.6780%. A count match, not a rounding match, is our evidence that the figure is right for its window. NYMERŌ’s page describes the same reduction convention we use; we have not independently verified that its count was produced that way.
A note on scope: the prediction above covered Life Path 33 only. The full twelve-number comparison in our internal review was exploratory — those published figures were not in hand when the prediction was written. Only the 33 result was predicted in advance, and only it is reported as a confirmed prediction here.
Methodology, and how to reproduce it
Every figure on this page comes from code and data you can run yourself.
Method. Pythagorean, exactly as the rest of this site does it: day, month and year reduced separately, master numbers 11, 22 and 33 preserved at every stage, the three parts summed and reduced with masters preserved. See how we calculate. The study imports the site’s own Life Path function rather than reimplementing it, so the article and the calculator cannot drift apart.
Data. Daily U.S. birth counts, 1994–2014:
US_births_1994-2003_CDC_NCHS.csv— Centers for Disease Control and Prevention, National Center for Health Statistics, 3,652 daily rows.US_births_2000-2014_SSA.csv— Social Security Administration, 5,479 daily rows.
Both files were checked at load: every calendar date in range present, no gaps, no duplicates, and the day-of-week column matching the computed weekday on every row. Inside the window, CDC/NCHS supplies 1994–2003 and SSA supplies 2004–2014, so the overlap is counted once.
Attribution. Data from FiveThirtyEight, licensed CC BY 4.0; underlying birth counts from CDC/NCHS and SSA respectively.
Code. scripts/birth_weighted_study.py runs the seam test, the main analysis, the split-half and the leap-day sensitivity. scripts/rarity_study_1940_2009.py produces the 1940–2009 baseline behind our earlier rarity page. scripts/pathnumbers_comparison.py regenerates the comparison described above. scripts/gen_rarity_study_charts.py builds both charts from the recorded values. All four scripts, both input files and the derived tables are in the Zenodo package linked in the citation block below. The same package is mirrored on GitHub: https://github.com/cosmicsheofficial/life-path-rarity-study.
Licence. Our derived dataset is published under Creative Commons Attribution 4.0 International (CC BY 4.0). Use it, including commercially; just credit it.
Cite this analysis
Copy this as-is — no one should have to invent an attribution.
CosmicShe (2026). Why Life Path Rarity Percentages Disagree: A Birth-Weighted Analysis of 85,386,227 U.S. Births, 1994–2014. https://cosmicshe.com/life-path-rarity-study/
Method: https://cosmicshe.com/how-we-calculate/ · Dataset + code (CC BY 4.0): Zenodo, DOI below · Earlier calendar-only study: https://cosmicshe.com/life-path-rarity/
DOI: https://doi.org/10.5281/zenodo.22872268
Questions, answered.
So which percentage is correct?
All of them, inside the window each one names. 0.30% is correct for U.S. births 2000–2014. 0.68% is correct for calendar dates 1900–2025. 0.89% is correct for calendar dates 1940–2009. None of them is “the” rarity of Life Path 33, because that number doesn’t exist without a stated range. This is exactly why the four coordinates — method, window, population, weighting — belong next to every figure.
Does using real births instead of calendar dates change the answer?
Barely. Across 85,386,227 recorded U.S. births, the largest change to any Life Path’s share was 0.1053 percentage points, and the four rarest numbers stayed in the same order.
Then why do the published figures differ so much?
Mostly the years. For Life Paths 33, 2, 11, 4, 6 and 22, changing the year window moved the share more than weighting by real births did anywhere in this study.
Is Life Path 33 still the rarest?
Yes, in every window and both weightings we tested. What changes with the window is how rare — not its position.
Can I use this data?
Yes. The derived dataset is CC BY 4.0; the citation block above is ready to paste. The underlying birth counts are FiveThirtyEight’s, also CC BY 4.0, credited above.
Method: Pythagorean, parts reduced separately, masters preserved — see how we calculate.